
File:Discontinuity removable.eps.png

Size of this preview: 800 × 589 pixels. Other resolutions: 320 × 235 pixels | 640 × 471 pixels | 1,024 × 753 pixels | 1,280 × 942 pixels | 2,506 × 1,844 pixels.
Original file (2,506 × 1,844 pixels, file size: 72 KB, MIME type: image/png)
Summary
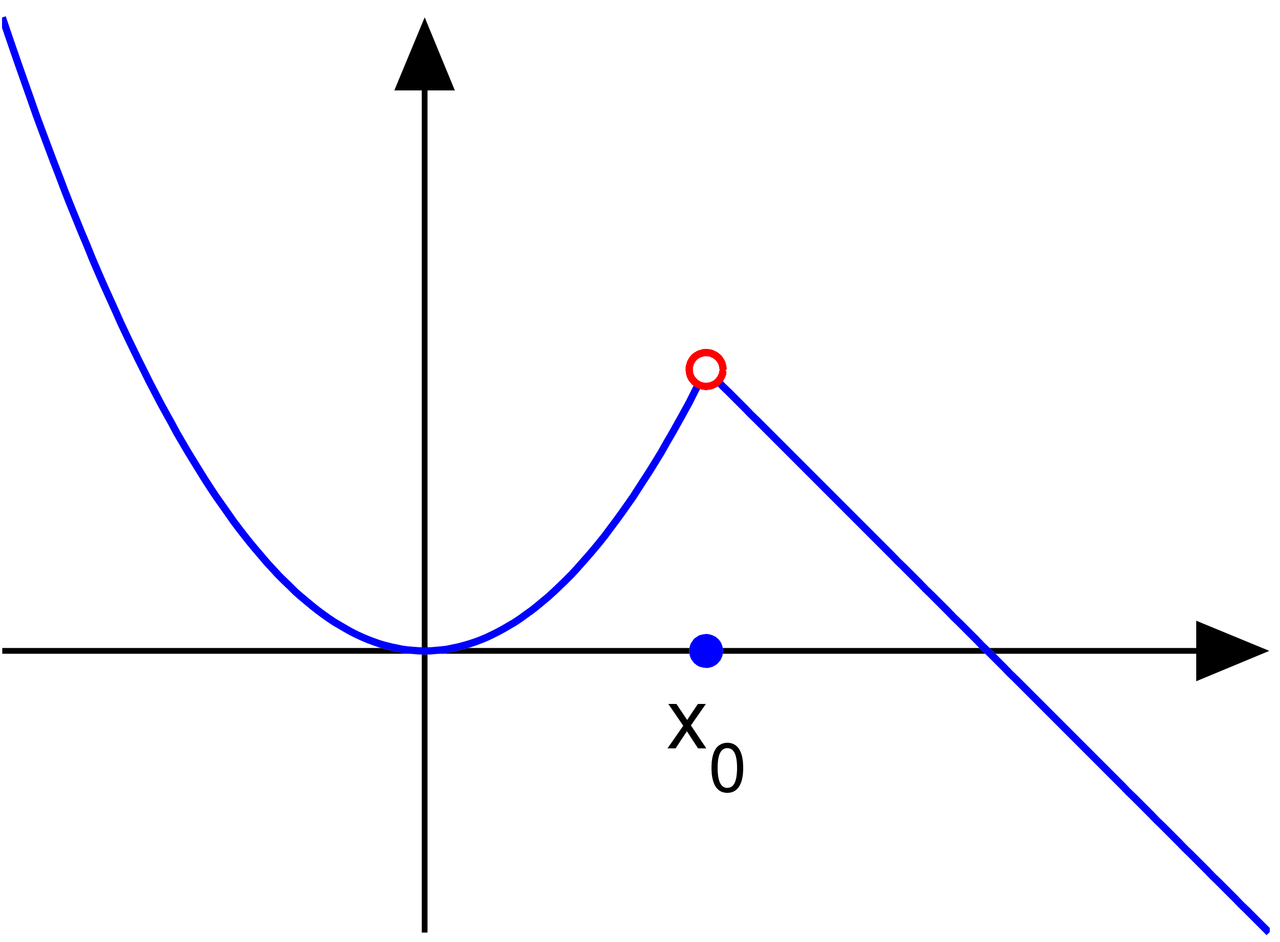
This diagram was created with MATLAB.

|
This math image could be re-created using vector graphics as an SVG file. This has several advantages; see Commons:Media for cleanup for more information. If an SVG form of this image is available, please upload it and afterwards replace this template with
{{vector version available|new image name}}.
It is recommended to name the SVG file “Discontinuity removable.eps.svg”—then the template Vector version available (or Vva) does not need the new image name parameter. |
Source code:
function discontinuity()

   % set up the plotting window
   thick_line=2.5; thin_line=2; arrow_size=14; arrow_type=2;
   fs=30; circrad=0.06;

% picture 1
   a=-1.5; b=3; h=0.02; x0=1;
   X1=a:h:x0; X2=x0:h:b; X=[X1 X2];
   Y1=X1.^2; Y2=Y1(length(Y1))+(-1)*(X2-X2(1)); Y=[Y1 Y2]; y01=Y1(length(Y1)); y02=Y2(1);

   figure(1); clf; hold on; axis equal; axis off;
   axes_points(a, b, thin_line, thick_line, arrow_size, arrow_type, x0, y01, y02, circrad, fs, X, Y, X1, Y1, X2, Y2)
   saveas(gcf, 'discontinuity_removable.eps', 'psc2')

% picture 2
   a=-1.5; b=3; h=0.02; x0=1;
   X1=a:h:x0; X2=x0:h:b; X=[X1 X2];
   Y1=X1.^2; Y2=2-(X2-x0).^2; Y=[Y1 Y2]; y01=Y1(length(Y1)); y02=Y2(1);

   figure(2); clf; hold on; axis equal; axis off;
   axes_points(a, b, thin_line, thick_line, arrow_size, arrow_type, x0, y01, y02, circrad, fs, X, Y, X1, Y1, X2, Y2)
   saveas(gcf, 'discontinuity_jump.eps', 'psc2')

% picture 3
   a=-1.5; b=3; h=0.001; x0=1;
   X1=a:h:x0; X2=x0:h:b; X=[X1 X2];
   Y1=sin(5./(X1-x0-eps)); Y2=0.1./(X2-x0+50*h); Y=[Y1 Y2]; y01=Y1(length(Y1)); y02=Y2(1);

   figure(3); clf; hold on; axis equal; axis off;
   axes_points2(a, b, thin_line, thick_line, arrow_size, arrow_type, x0, NaN, NaN, circrad, fs, X, Y, X1, Y1, X2, Y2)
   saveas(gcf, 'discontinuity_essential.eps', 'psc2')

disp('Converting to png...')
! convert -density 400 -antialias discontinuity_removable.eps discontinuity_removable.png
! convert -density 400 -antialias discontinuity_jump.eps discontinuity_jump.png
! convert -density 400 -antialias discontinuity_essential.eps discontinuity_essential.png

function axes_points(a, b, thin_line, thick_line, arrow_size, arrow_type, x0, y01, y02, circrad, fs, X, Y, X1, Y1, X2, Y2)
   arrow([a 0], [b, 0], thin_line, arrow_size, pi/8,arrow_type, [0, 0, 0]) % xaxis
   small=0.2; arrow([0, min(Y)], [0, max(Y)], thin_line, arrow_size, pi/8,arrow_type, [0, 0, 0]); % y axis

   plot(X1, Y1, 'linewidth', thick_line); plot(X2, Y2, 'linewidth', thick_line)

   ball(x0, 0, circrad, [0 0 1 ]);
   ball_empty(x0, y01, thick_line, circrad, [1 0 0 ]); ball_empty(x0, y02, thick_line, circrad, [1 0 0 ]);
   H=text(x0, -0.006*fs,  'x_0'); set(H, 'fontsize', fs, 'HorizontalAlignment', 'c', 'VerticalAlignment', 'c')

function axes_points2(a, b, thin_line, thick_line, arrow_size, arrow_type, x0, y01, y02, circrad, fs, X, Y, X1, Y1, X2, Y2)
   arrow([a 0], [b, 0], thin_line, arrow_size, pi/8,arrow_type, [0, 0, 0]) % xaxis
   small=0.2; arrow([0, min(Y)], [0, max(Y)], thin_line, arrow_size, pi/8,arrow_type, [0, 0, 0]); % y axis

   plot(X1, Y1, 'linewidth', thick_line); plot(X2, Y2, 'linewidth', thick_line)

   ball(x0, 0, circrad, [0 0 1 ]);
   ball_empty(x0, y01, thick_line, circrad, [1 0 0 ]); ball_empty(x0, y02, thick_line, circrad, [1 0 0 ]);
   H=text(x0+0.2, -0.006*fs,  'x_0'); set(H, 'fontsize', fs, 'HorizontalAlignment', 'c', 'VerticalAlignment', 'c')

function ball(x, y, r, color)
   Theta=0:0.1:2*pi;
   X=r*cos(Theta)+x;
   Y=r*sin(Theta)+y;
   H=fill(X, Y, color);
   set(H, 'EdgeColor', 'none');


function ball_empty(x, y, thick_line, r, color)
   Theta=0:0.1:2*pi;
   X=r*cos(Theta)+x;
   Y=r*sin(Theta)+y;
   H=fill(X, Y, [1 1 1]);
   %set(H, 'EdgeColor', color);
  plot(X, Y, 'color', color, 'linewidth', thick_line);


function arrow(start, stop, thickness, arrowsize, sharpness, arrow_type, color)


%  draw a line with an arrow at the end
%  start is the x,y point where the line starts
%  stop is the x,y point where the line stops
%  thickness is an optional parameter giving the thickness of the lines
%  arrowsize is an optional argument that will give the size of the arrow
%  It is assumed that the axis limits are already set
%  0 < sharpness < pi/4 determines how sharp to make the arrow
%  arrow_type draws the arrow in different styles. Values are 0, 1, 2, 3.

%       8/4/93    Jeffery Faneuff
%       Copyright (c) 1988-93 by the MathWorks, Inc.
%       Modified by Oleg Alexandrov 2/16/03


   if nargin <=6
      color=[0, 0, 0];
   end

   if (nargin <=5)
      arrow_type=0;   % the default arrow, it looks like this: ->
   end

   if (nargin <=4)
      sharpness=pi/4; % the arrow sharpness - default = pi/4
   end

   if nargin<=3
      xl = get(gca,'xlim');
      yl = get(gca,'ylim');
      xd = xl(2)-xl(1);
      yd = yl(2)-yl(1);
      arrowsize = (xd + yd) / 2;   % this sets the default arrow size
   end

   if (nargin<=2)
      thickness=0.5; % default thickness
   end


   xdif = stop(1) - start(1);
   ydif = stop(2) - start(2);

   if (xdif == 0)
      if (ydif >0)
         theta=pi/2;
      else
         theta=-pi/2;
      end
   else
      theta = atan(ydif/xdif);  % the angle has to point according to the slope
   end

   if(xdif>=0)
      arrowsize = -arrowsize;
   end

   if (arrow_type == 0) % draw the arrow like two sticks originating from its vertex
      xx = [start(1), stop(1),(stop(1)+0.02*arrowsize*cos(theta+sharpness)),NaN,stop(1),...
            (stop(1)+0.02*arrowsize*cos(theta-sharpness))];
      yy = [start(2), stop(2), (stop(2)+0.02*arrowsize*sin(theta+sharpness)),NaN,stop(2),...
            (stop(2)+0.02*arrowsize*sin(theta-sharpness))];
      plot(xx,yy, 'LineWidth', thickness, 'color', color)
   end

   if (arrow_type == 1)  % draw the arrow like an empty triangle
      xx = [stop(1),(stop(1)+0.02*arrowsize*cos(theta+sharpness)), ...
            stop(1)+0.02*arrowsize*cos(theta-sharpness)];
      xx=[xx xx(1) xx(2)];

      yy = [stop(2),(stop(2)+0.02*arrowsize*sin(theta+sharpness)), ...
            stop(2)+0.02*arrowsize*sin(theta-sharpness)];
      yy=[yy yy(1) yy(2)];

      plot(xx,yy, 'LineWidth', thickness, 'color', color)

%     plot the arrow stick
      plot([start(1) stop(1)+0.02*arrowsize*cos(theta)*cos(sharpness)], [start(2), stop(2)+ ...
                    0.02*arrowsize*sin(theta)*cos(sharpness)], 'LineWidth', thickness, 'color', color)

   end

   if (arrow_type==2) % draw the arrow like a full triangle
      xx = [stop(1),(stop(1)+0.02*arrowsize*cos(theta+sharpness)), ...
            stop(1)+0.02*arrowsize*cos(theta-sharpness),stop(1)];

      yy = [stop(2),(stop(2)+0.02*arrowsize*sin(theta+sharpness)), ...
            stop(2)+0.02*arrowsize*sin(theta-sharpness),stop(2)];
      H=fill(xx, yy, color);% fill with black
      set(H, 'EdgeColor', 'none')

%     plot the arrow stick
      plot([start(1) stop(1)+0.01*arrowsize*cos(theta)], [start(2), stop(2)+ ...
                    0.01*arrowsize*sin(theta)], 'LineWidth', thickness, 'color', color)
   end

   if (arrow_type==3) % draw the arrow like a filled 'curvilinear' triangle
      curvature=0.5; % change here to make the curved part more curved (or less curved)
      radius=0.02*arrowsize*max(curvature, tan(sharpness));
      x1=stop(1)+0.02*arrowsize*cos(theta+sharpness);
      y1=stop(2)+0.02*arrowsize*sin(theta+sharpness);
      x2=stop(1)+0.02*arrowsize*cos(theta)*cos(sharpness);
      y2=stop(2)+0.02*arrowsize*sin(theta)*cos(sharpness);
      d1=sqrt((x1-x2)^2+(y1-y2)^2);
      d2=sqrt(radius^2-d1^2);
      d3=sqrt((stop(1)-x2)^2+(stop(2)-y2)^2);
      center(1)=stop(1)+(d2+d3)*cos(theta);
      center(2)=stop(2)+(d2+d3)*sin(theta);

      alpha=atan(d1/d2);
      Alpha=-alpha:0.05:alpha;
      xx=center(1)-radius*cos(Alpha+theta);
      yy=center(2)-radius*sin(Alpha+theta);
      xx=[xx stop(1) xx(1)];
      yy=[yy stop(2) yy(1)];

      H=fill(xx, yy, color);% fill with black
      set(H, 'EdgeColor', 'none')

%     plot the arrow stick
      plot([start(1) center(1)-radius*cos(theta)], [start(2), center(2)- ...
                    radius*sin(theta)], 'LineWidth', thickness, 'color', color);
   end
Transferred from en.wikipedia to Commons by Maksim.
The original description page was removable.eps.png here. All following user names refer to en.wikipedia.
| date/time | username | edit summary |
|---|---|---|
| 03:11, 14 September 2005 | en:User:Oleg Alexandrov | (<span class="autocomment"><a href="/wiki/Image:Discontinuity_removable.eps.png#Licensing" title="Image:Discontinuity removable.eps.png">→</a>Licensing</span>) |
| 00:51, 12 September 2005 | en:User:Oleg Alexandrov | (Made by me with matlab. ) |
Original upload log
Legend: (cur) = this is the current file, (del) = delete this old version, (rev) = revert to this old version.
Click on date to download the file or see the image uploaded on that date.
- (del) (cur) 01:28, 12 September 2005 . . en:User:Oleg_Alexandrov Oleg Alexandrov ( en:User_talk:Oleg_Alexandrov Talk) . . 376x277 (9967 bytes)
- (del) (rev) 00:51, 12 September 2005 . . en:User:Oleg_Alexandrov Oleg Alexandrov ( en:User_talk:Oleg_Alexandrov Talk) . . 376x275 (7002 bytes) (Made by me with matlab. { { PD } })
Licensing
| This chart is ineligible for copyright and therefore in the public domain, because it consists entirely of information that is common property and contains no original authorship. For more information, see Commons:Threshold of originality § Charts
|
File history
Click on a date/time to view the file as it appeared at that time.
| Date/Time | Thumbnail | Dimensions | User | Comment | |
|---|---|---|---|---|---|
| current | 04:17, 11 July 2013 | | 2,506 × 1,844 (72 KB) | Oleg Alexandrov | Made the point on the axis blue, per request, this is how it should be. |
| 18:09, 18 March 2006 |  | 376 × 277 (10 KB) | Maksim | La bildo estas kopiita de wikipedia:en. La originala priskribo estas: == Summary == Made by me with matlab. {{PD}} == Licensing == {{PD-self}} Source code: <pre> function discontinuity() % set up the plotting window thick_line=2.5; thin_line=2 |
File usage
The following page uses this file:
Global file usage
The following other wikis use this file:
- Usage on de.wikipedia.org
- Usage on en.wikipedia.org
- Usage on es.wikipedia.org
- Usage on fa.wikipedia.org
- Usage on fr.wikipedia.org
- Usage on he.wikipedia.org
- Usage on it.wikipedia.org
- Usage on ja.wikipedia.org
- Usage on ko.wikipedia.org
- Usage on lmo.wikipedia.org
- Usage on nl.wikipedia.org
- Usage on ru.wikipedia.org
- Usage on tl.wikipedia.org
- Usage on www.wikidata.org
- Usage on zh.wikipedia.org