
File:Speed of sound in water.svg

Size of this PNG preview of this SVG file: 720 × 540 pixels. Other resolutions: 320 × 240 pixels | 640 × 480 pixels | 1,024 × 768 pixels | 1,280 × 960 pixels | 2,560 × 1,920 pixels.
Original file (SVG file, nominally 720 × 540 pixels, file size: 36 KB)
Summary
| Description |
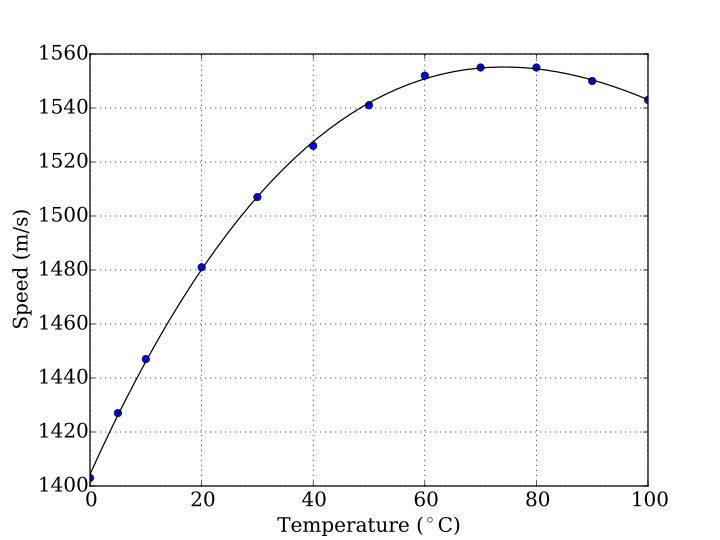
English: Graph of the speed of sound in water vs temperature. Tabulated values (circle markers) from "The Engineering Toolbox" [1].
Smooth continuous line is a 3rd degree polynomial fit (see below) calculated on the tabulated data, accurate within 0.1%.
Español: Gráfico de la rapidez del sonido en el agua versus temperatura. Los datos tabulados (círculos) se obtuvieron de "The Egineering Toolbox" [2].
La línea continua es un ajuste polinomial de orden 3 (ver abajo) calculado a partir de los datos tabulados, la precisión es del 0.1%.
C(T) = a0 + a1T + a2T2 + a3T3 (m/s) """
Plot of the speed of sound versus temperature in water
The data is obtained from "The Engineering Toolbox" [1]_
References
----------
.. [1] The Engineering Toolbox. Water - Speed of Sound.
Accesed: April 27, 2015.
http://www.engineeringtoolbox.com/sound-speed-water-d_598.html
"""
import numpy as np
import matplotlib.pyplot as plt
from matplotlib import rcParams
rcParams['font.family'] = 'serif'
rcParams['font.size'] = 16
data = np.array([
[ 0., 1403.],
[ 5., 1427.],
[ 10., 1447.],
[ 20., 1481.],
[ 30., 1507.],
[ 40., 1526.],
[ 50., 1541.],
[ 60., 1552.],
[ 70., 1555.],
[ 80., 1555.],
[ 90., 1550.],
[ 100., 1543.]])
temp = data[:, 0]
vel = data[:, 1]
a3, a2, a1, a0 = np.polyfit(temp, vel, 3)
temp_fit = np.linspace(0,100)
vel_fit = a0 + a1*temp_fit + a2*temp_fit**2 + a3*temp_fit**3
plt.plot(temp, vel, 'o')
plt.plot(temp_fit, vel_fit, 'k')
plt.grid(True)
plt.xlabel(r"Temperature ($^\circ$C)")
plt.ylabel(r"Speed (m/s)")
plt.savefig("Speed_of_sound_in_water.svg")
|
| Date | |
| Source | Own work |
| Author | K. Krallis, SV1XV |
Licensing
This file is licensed under the Creative Commons Attribution 1.0 Generic license.
- You are free:
- to share – to copy, distribute and transmit the work
- to remix – to adapt the work
- Under the following conditions:
- attribution – You must give appropriate credit, provide a link to the license, and indicate if changes were made. You may do so in any reasonable manner, but not in any way that suggests the licensor endorses you or your use.
File history
Click on a date/time to view the file as it appeared at that time.
| Date/Time | Thumbnail | Dimensions | User | Comment | |
|---|---|---|---|---|---|
| current | 21:16, 27 April 2015 | | 720 × 540 (36 KB) | Nicoguaro | Similar formatting to other plots in the article. Added Python code (and data) for the automatic generation of the file. |
| 15:24, 26 August 2014 |  | 757 × 591 (52 KB) | Sv1xv | {{Information |Description ={{en|1=Graph of the velocity of sound in water vs temperature. Original values and 3rd degree polynomial fit on data from "The Engineering Toolbox" [http://www.engineeringtoolbox.com/sound-speed-water-d_598.html]. Smoothe... |
File usage
The following page uses this file:
Global file usage
The following other wikis use this file:
- Usage on ckb.wikipedia.org
- Usage on en.wikipedia.org
- Usage on vi.wikipedia.org